 There is no way around it,
finding the SIP call flow is the first thing you have to do when you are facing a SIP call failure.
Why?
Easy.
Because first of all, you have to understand whether this is a call routing problem or signaling/media compatibility issue.
SIP call flow helps you understand just that, and in a lot of cases, you can pinpoint the problem just from looking at the SIP call flow.

Build pro IOS configs. FAST.
For example,
consider a SIP trunk that you have from CUCM towards an IOS SIP GW.
Curiously outgoing calls from a specific phone fail.
Looking at the SIP call flow you see that the SIP GW rejects your call,
and while initially, you aren’t sure why you see that the CUCM that initiated the SIP request is not one of the servers that you’ve configured on the SIP GW.
You may as well find that the CUCM server that routes the call is in a remote DC and an FW might be dropping the traffic,
or you may even discover that CUCM sends the call to another SIP Trunk because of some admission control issues.
Bottom line, until you understand the SIP call flow, you are in the dark.
You are just guessing.
And let’s face it, although we like an occasional bet,
this is not what we are paid to do,
we are not in the guessing business.
But wait,
Before we get to the cool tools, we should really try and understand the call flow as we think it should be, just take a pen and paper and draw some lines.
Nothing fancy, just the protocols and peers.
This is an example of a call from a SIP phone to an ITSP via CUBE.

Just by jotting it down I realized that I have two FW’s that I have to take into account.
If you can add some geographical parameters it would be even better.
This simple process will get your wheels turning and will give you quite a few ideas as to what could have gone wrong, or at least where to start looking.
Now, we all know that troubleshooting SIP can be a daunting task.
Dozens of calls on the SIP GW and CUBE, endless scroll of CPU consuming debugs, no filters, Gigs of CUCM logs and whatnot, and although this can be learned ,there’s a way to get going quickly.
CUCM RTMT Session Trace.
The RTMT Session Trace is a tool that can help you filter and trace call flows,
specifically, SIP call flows.
It’s enabled by default, but if it fails to work, check the following Enterprise Parameters
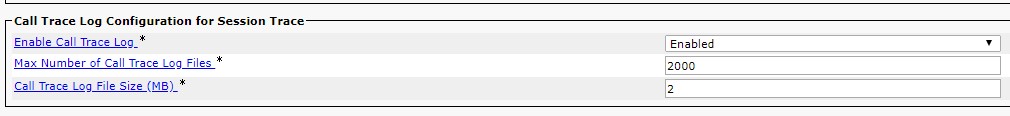
Also note that if you are running a CUCM 11.5, you may be facing the CSCvb09481 bug.
Different RTMT versions name the tool differently, but it’s easy to find.
Open RTMT, go to Voice/Video (CallManager in earlier versions)–>CallProcess–>Seesion Trace Log View (Session Trace in earlier versions).
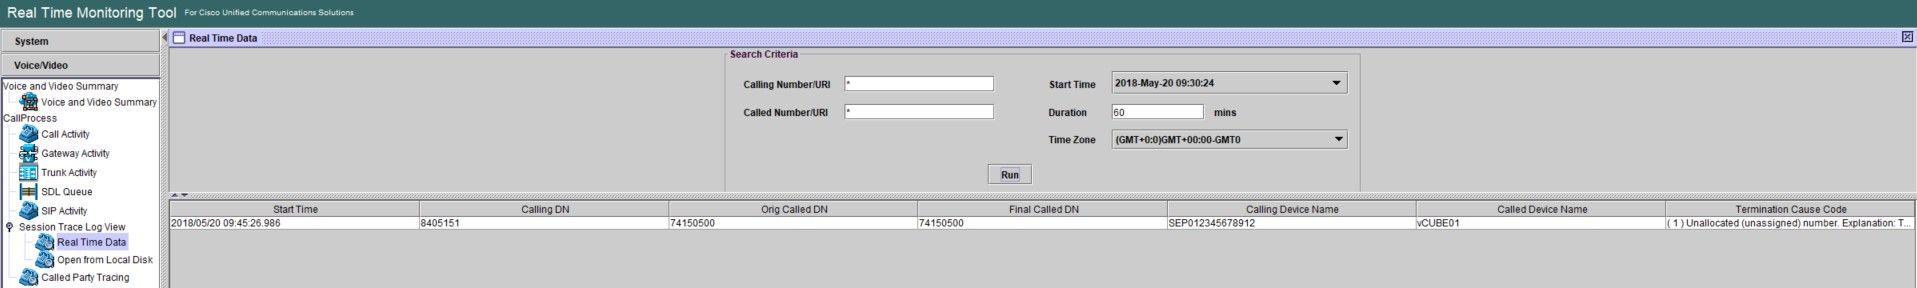
There’s a pitfall though, the search often returns zero results, and because the time window can’t be set to more than 60 minutes you may think that the damn thing just doesn’t work.
In most cases, it’s just a matter of setting the proper TimeZone.
If you are having issues, go to CUCM CLI and enter utils ntp status.
Watch the output and set the TimeZone and the time to the time window of the call (Watch out for DST changes).
Yes, I did notice that I just covered three potential issues right off the bat,
and to be honest, in the beginning, I resentfully crossed out the Session Trace tool following some harsh words aimed at Cisco’s developers (sorry guys).
You have to understand that I was busy troubleshooting a SIP issue, not a Session Trace issue.
But it ended up just like that song that you won’t listen to, because of how it starts, but once you finally take the time to listen to it (a year later), it becomes your favorite one…
So don’t give up on it just yet, because once you tame this beast, your SIP troubleshooting time will shorten dramatically.
Back to work.
Once your search result bears fruit, just double click the call you want to trace and voila!
This is some priceless information right here.
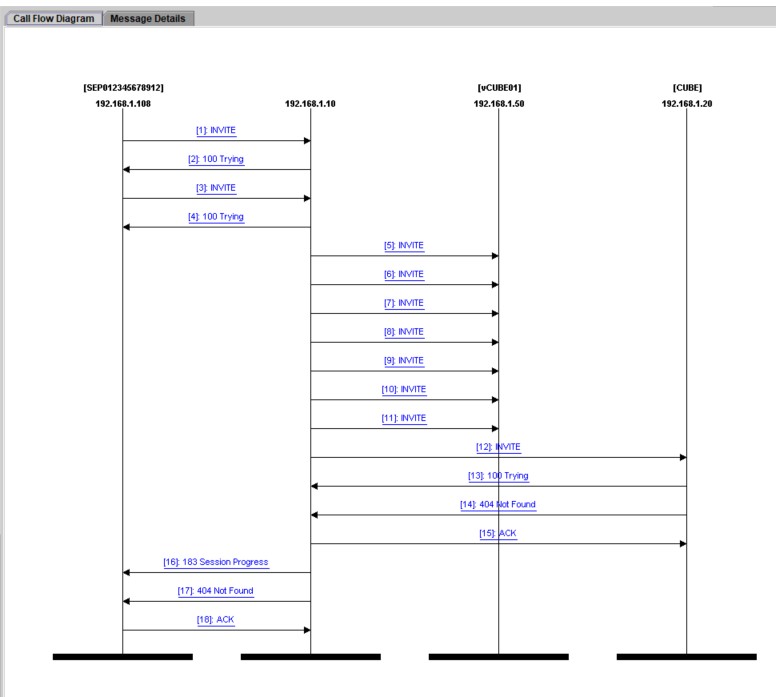
At a glance, I can identify the active CUCM for that call (might be more than one),
I can see that the call is first routed to vCUBE01, which doesn’t answer any of the CUCM’s INVITES, and then the call is routed to CUBE which returns a 404 Not Found response.
Absolutely fantastic, that is so much information to work with.
I can now go ahead and check my CUCM call routing if that’s not what I expected to see,
I can check FW’s for drops between CUCM and vCUBE01,
I can debug vCUBE01 to see if it received any of the INVITEs and see why it won’t respond, or go straight to CUBE and figure out why am I getting a 404 Not Found.
Either way, I already have the big picture,
I just need to follow up on the leads I’ve got, to find the source of the problem.
Great results, short time, no guesswork.
Let me know what you think in the comments.
Build pro IOS configs. FAST.