When there’s trouble in the network, and voice services are suffering, those in need will call upon you, the networking superhero! As a superhero, you use your x-ray vision to zoom in to the microscopic world of voice packets, to perform a Wireshark packet analysis, and to investigate the malfunction and make things right. Then you will be hailed as the liberator and protector of the network!

OK, OK, so I went a bit overboard. But remember, you are a networking superhero, and instead of x-ray vision, you have a set of tools that allow you to essentially do the same thing. This superpower can be bestowed upon you by Wireshark, a free, powerful packet sniffer and analyzer.
Build pro IOS configs. FAST.
In a previous article we introduced the ways in which voice packets can be captured on a computer running Wireshark. In this article, we’ll introduce the Wireshark software and give you an initial tour of its features and capabilities to get you started.
Wireshark as a tool can be intimidating at first, and I know this because this was the case for me. But once you get the hang of it, you will truly see what a powerful tool it is and it will quickly become one of the primary instruments in your troubleshooting toolbox.
Contents
Introduction to Wireshark Packet Analysis
Wireshark is a piece of software that you can download and install for free on your computer. Although it is available for Mac and for some Linux-based systems, it is the Windows version that will be shown here.
In this introduction, we’ll look at generic packet capture examples that don’t necessarily have to do with VoIP. This is done in order to first get a basic understanding of Wireshark packet analysis and how it works. In the next section, you’ll get a chance to see some real packet capture scenarios that involve voice applications.
Running Wireshark for the First Time
Once installed and when run for the first time, a window similar to the following will appear.

All of the available interfaces on the computer, including wired, wireless and Bluetooth interfaces are displayed and the traffic that is detected on each is shown in a small graph. At this point, the application is ready to begin capturing packets. The filter field allows you to enter various parameters that will cause Wireshark to capture only specific packets. Although this can be done now, the same filters can be applied after the capture to display only the desired packets.
To begin capturing, click the interface of choice and then click the Start Capture button which looks like a shark’s fin (  ) at the top left. Make sure you select the appropriate interface (wired, or wireless in the case of a laptop) in order to capture the packets you require.

After clicking the Start Capture button, the window changes to a three paned format, where the packets being captured are displayed in the first pane. These packets are displayed in a table as lines of digits and text and as traffic continues to traverse the network card, they increase in number. Depending on what network applications you are running at the time, the table will be populated at a varying rate.
Within seconds, you can press the Stop Capture button (  ) to end the capture process.
The Three Panes
Once the capture is complete, you should end up with something similar to this. Notice the three panes displayed within the Wireshark window.

The First Pane – A List of Packets
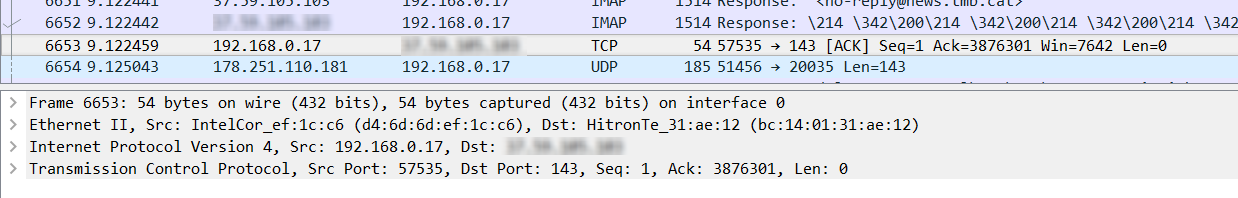
The first pane, known as the ‘packet list pane’, contains a list of packets in table format. Each column indicates a specific parameter of each packet in particular. The columns displayed are the following:
- No. – The number assigned to the packet. On arrival each packet is assigned a number for the specific capture, in sequential order starting at one. In the above screenshot you can see that over 6600 packets have been captured.
- Time – This is the number of seconds that have elapsed between the beginning of the capture and the receiving of that particular packet.
- Source and Destination – These columns indicate the source and destination IP addresses found in the header of the IP packet itself. This information comes from Layer 3 of the OSI model, the Network Layer.
- Protocol – This column indicates the Transport Layer protocol being used. Occasionally, this may indicate the Application Layer protocol in use depending on the specific protocols in question. In the above examples, packets using the TCP and UDP protocols can be seen, as well as some using IMAP, an Application Layer protocol used for email.
- Length – This indicates the size of the specific packet in bytes.
- Info – This field contains specific information about the packet in question. Its contents depend on the protocol being used and will vary accordingly.
The above columns provide this information so that individual conversations with particular parameters can be identified and picked out. Once the parameters have been determined, you can dive deeper into each packet and examine its contents. That is where the second pane comes in.
The Second Pane – Layered Information
This is where Wireshark packet analysis begins to take form. Once you scroll through the first pane and find the packet involved in the traffic exchange that you’re looking for, you can click on it to find out more about the information the packet contains. In the following close-up of the above capture, we’ve clicked on packet number 6653 in the first pane. The second pane, also referred to as the ’packet details pane’, immediately displays information about that packet.
Now this is where the layers of the OSI model come in handy. In the second pane, you can see four entries. Each of these entries is preceded by a greater-than sign (>), on the far left side of the text, which if you click, will expand the entry and show various pieces of information. Some entries have subentries that can be further expanded.
The first entry that begins Frame 6653 includes generic information about the specific packet, when it arrived, what its size is and on which interface it was captured on. This is general information about that specific packet.
The next three entries correspond to Layers 2, 3 and 4 of the OSI model.
The Ethernet II entry includes information as shown in the expanded entry below.
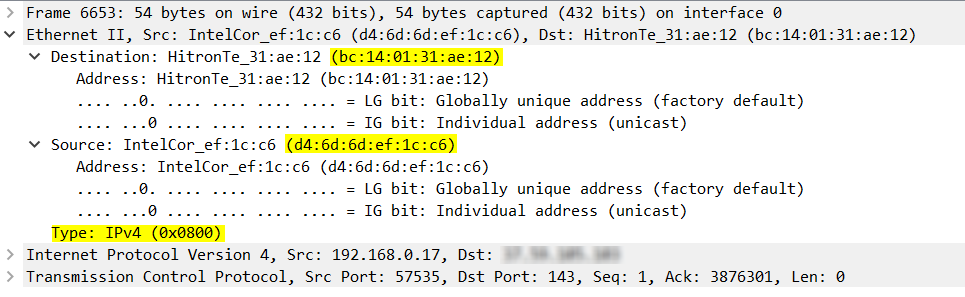
This is the information found within the header of the Data Link Layer, which is Layer 2. Both the source and destination MAC addresses can be seen as well as the value of the Type field which is IPv4 for those who are more familiar with the Ethernet header.
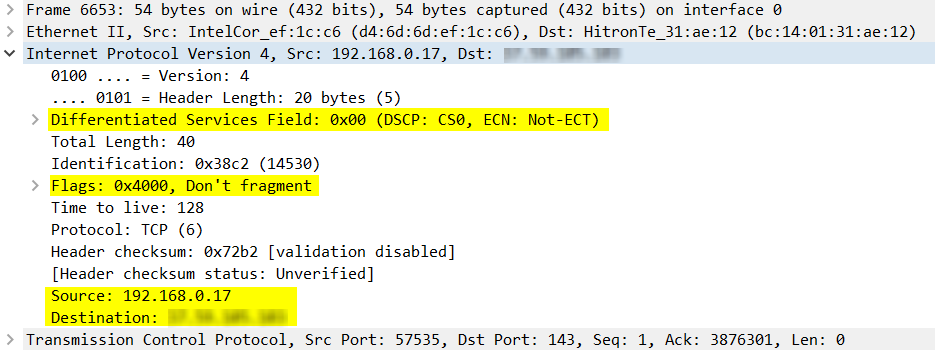
The Internet Protocol Version 4 entry when expanded includes the source and destination IP addresses at the very end as well as additional useful information such as Differentiated Services, where Quality of Service mechanisms are implemented, as well as some flag bits dealing with IP packet fragmentation. This information is found within the IP header which operates at Layer 3 of the OSI model, the Network Layer.
If you are familiar with the contents of the IP header, you may be able to identify additional parameters that are displayed.
The Transmission Control Protocol entry exhibits information found within the Transport Layer header. Now depending on the protocol being used at this layer, the resulting information being displayed can vary widely. In this particular case, it is the TCP protocol being used here so we are viewing the information found within the header of the TCP segment. This information includes source and destination ports used by specific applications on the device, sequence and acknowledgement numbers used to employ reliability mechanisms, flags used to initiate and tear down sessions, and window size which regulates flow control.
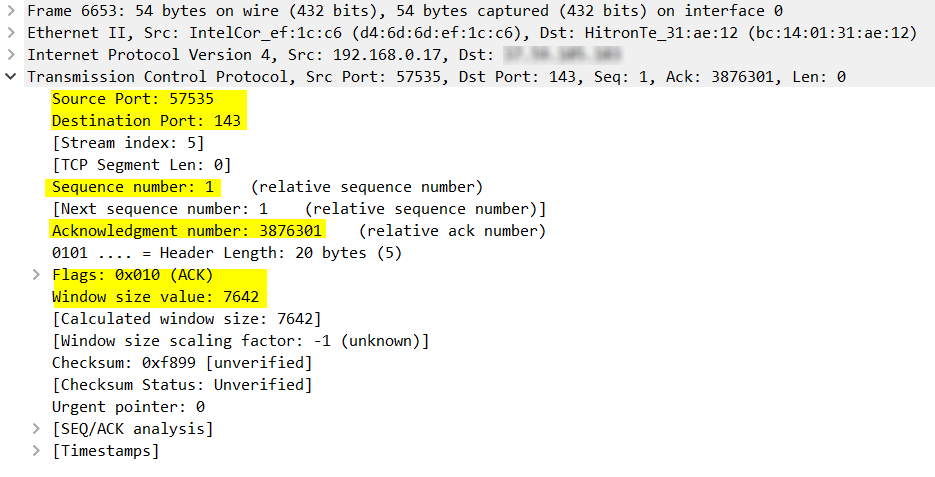
From the above information we can deduce that since the destination port is 143, this packet is a part of a session retrieving an email message. Port 143 is used by the Internet Mail Access Protocol (IMAP), a protocol used to retrieve email and synchronize folders between an email server and clients.
Additional Entries – Occasionally, Wireshark may display an additional entry below the Transport Layer on the second pane to indicate a protocol that is running on top of the Transport Layer protocol in question. An example of such a case is with voice, where control packets using the SIP protocol will have an additional entry for SIP parameters, and where packets carrying the actual voice have an entry for RTP, the protocol used to transport the actual voice. Both of these will be examined more in depth in the final section of this document.
Now it’s unnecessary to fully understand all of the information displayed for each layer as explained in this section, however, it does give you an understanding of the level of detail Wireshark will go into when capturing packets. And remember, that what we have seen so far is a vast amount of information for just one packet. Wireshark captures and saves such information for each and every packet!
The Third Pane – Going Deep
The third pane, known as the ‘packet bytes pane’, is of limited use when troubleshooting for voice, however, it is included here for completeness. This pane displays the full contents of the selected packet including all headers in a standard format called hex dump, which uses hexadecimal values to display the contents. By clicking on the various entries in the second pane, you can see which parts of the hex dump correspond to that information. Below, the source port value of the TCP entry is selected, and the hex digits that correspond to that value are highlighted in the third pane.
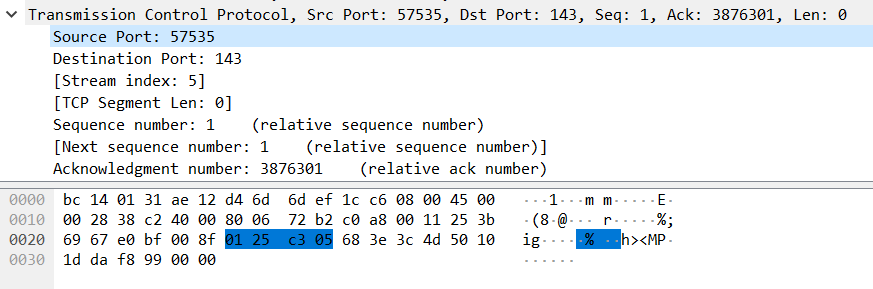
On an aside, this very eloquently makes a case for enabling encryption of any communication session, whether voice or otherwise. If this had been a session where passwords were exchanged, those passwords could actually be reconstructed from the data found in these hex dumps, unless adequately encrypted.
The selected packet is only 54 bytes long, which is quite small, so its full contents can easily fit within the third pane. Typically, packets can be up to 1500 bytes in length or even longer depending on how the network is configured. In such cases you would often scroll down to see the full contents of the packet. VoIP packets, both control packets as well as those that carry the voice samples themselves, are typically smaller in length.
Filtering Wireshark Packet Analysis Results
As was made evident from the above screenshots, a file capture, even one lasting only several seconds, can result in hundreds or even thousands of captured packets. The most difficult part of packet analysis can often be sorting through all of the available data to find the meaningful information for your troubleshooting activities.
Wireshark packet analysis has powerful filtering mechanisms enabling you to filter based on a multitude of parameters. Wireshark’s display filter reference page includes literally thousands of parameters you can use to winnow the results down to the specific packets you’re looking for.
Once the capture is complete, you can enter the filter parameters in the field labeled Apply a display filter… As seen in the following image, while typing the filter parameter, a window appears containing suggestions and options to complete the filter. This is very helpful, especially if you’re unfamiliar with the necessary syntax.
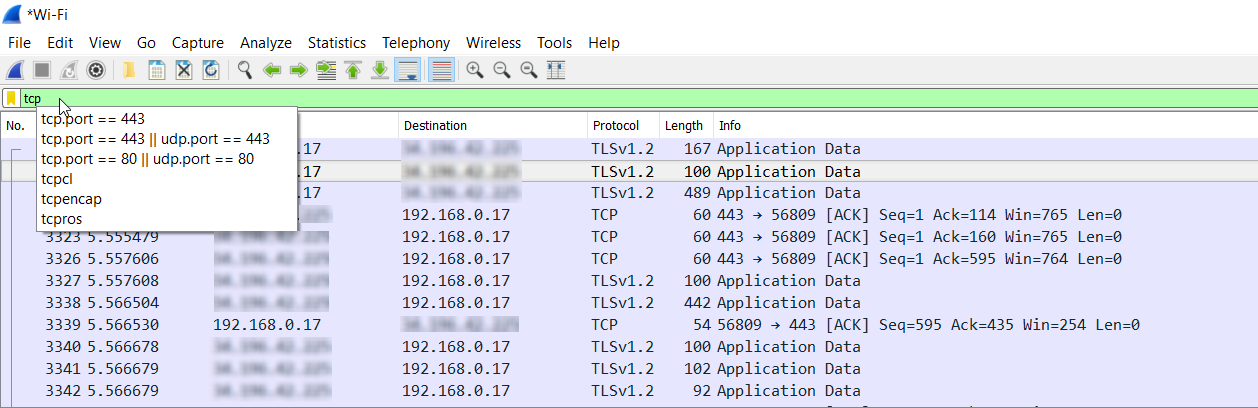
In order to filter out all of the packets that have a destination port number of 443, we can use the tcp.port == 443 filter parameter. When this is done, only the packets destined for this port are displayed in the packet list. Note that port 443 is used by the HTTPS protocol for secure web communication.


Also notice that as you type in the filter field, whenever the text you type is valid, the field will turn green. This means that you can safely press Enter and the results will be filtered. If it turns pink, the text as it is typed is invalid and will not bring about a valid result if entered as is.
Now it is possible to combine multiple statements using logical AND and OR operations where each statement is separated by the words and or or to achieve this. The following image shows such an example, where all of the packets in the packet capture are filtered to display only those that have a TCP port of 443 and a source IP address of 192.168.0.17. The application of this filter results in a list of packets generated by the local PC having a destination port number of 443. This can be confirmed from the resulting information found in the first pane as shown below.

Out of the thousands of packets captured, only nine packets appear in the above results. This shows how powerful filtering can be, and how, with the appropriate parameters, it is perfectly possible to narrow your search to the few packets that you are interested in viewing.
You are able to string together as many statements as you like with the and and or keywords. Alternatively, you can use the && and || symbols respectively.
You can further research Wireshark’s filtering mechanisms and features by viewing some of the links at the end of this document and by practicing viewing packets using Wireshark yourself.
Managing .pcap files
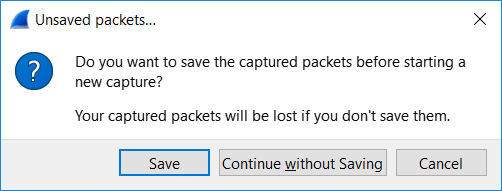
Once the Wireshark packet analysis capture is complete, you are able to save the capture information into a .pcap file. If you attempt to close Wireshark or to begin a new capture, you are informed that your current capture will be lost and are prompted to save the file or discard the captured packets.
Once saved, the file can be shared just like any other document. To get an idea of how large .pcap files can get, the file created in this example contains 7284 packets and has a size of 7.45 MB. The duration of the capture was just over 10 seconds.
The actual size of the file always depends on the number of packets and on the type of traffic that is captured. This particular capture had a YouTube video playing in the background, so there were many packets captured in a small amount of time and the size of most of the packets was close to the maximum of 1500 bytes. Other traffic captures, such as voice, may be substantially smaller as the size of each packet for such applications is typically much smaller, on the order of tens to a couple hundred bytes.

Security Notice: Be very careful with whom you share your .pcap files. These files can contain sensitive information including registration passwords, server IP addresses and user names if not encrypted. They also contain personal information which, if proliferated, can even result in serious legal repercussions. Voice conversations can even be reconstructed and listened to quite easily using Wireshark itself.
When sending such files to technical and helpdesk staff, it is always a good idea to zip them and secure the compressed file with a password. If you send the file over email, make sure to share the password of the compressed file with the recipient through other means, such as IM or text.
Performing a Wireshark Packet Analysis Capture from start to finish
The above sections describe how to use Wireshark and it goes into a fair amount of detail for each stage of the process. This section is a high-level step-by-step summary of those steps that describe how to perform a Wireshark capture from start to finish.
First, it is necessary to appropriately prepare the network and the devices from which you desire to capture packets. Once this is done, follow these steps:
- Open the Wireshark application.
- Make sure to select the appropriate interface to capture packets from.
- Click the Start Capture button, which looks like a shark’s fin (
 ) at the top left, to begin capturing.
 - Begin generating the traffic that you would like to capture. In the case of capturing voice, initiate a phone call on the device in question. You should begin to see packets populating the first pane.
- Make sure to perform any and all related activities on the devices to capture all of the relevant packets. For example, initiate a phone call, make sure some voice is actually sent by speaking into the receiver, perform any pertinent actions such as call hold, call transfer or anything else you’d like to test, and then hang up the phone to capture the exchange of packets that tear down the call.
- Once all of the actions have been performed, you can press the Stop Capture button ( ) to end the capture process.
- Review the list of captured packets in the first pane. Go through the timestamps of each and verify that the duration of the capture does indeed match the amount of time between starting and stopping the capture.
- To save the capture in a .pcap file, click File Save As… and save it to the location of your choice.
- This file can now be shared just like any other file you may have saved on your computer.
Build pro IOS configs. FAST.
Conclusion for Wireshark Packet Analysis
Now you have a general understanding of how to capture packets, how to filter them, and how to save and share .pcap files. Hopefully, if you’ve attempted some of the tasks on your own computer using Wireshark packet analysis, you’ve begun to more easily find your way around the software. Remember, practice is the most important thing when it comes to using your x-ray vision… I mean, when it comes to using Wireshark. Experience is key. Stay tuned for our next article where we’ll be looking at some of the VoIP-specific tools of Wireshark and how you can employ them in your superhero endeavors.